

Edited English translation of the original Chinese case. The original images and on-screen Chinese text are retained. Model names and example settings describe that source version; check current model documents for a new project.
Display requirement
The source combines custom digital-signage graphics with readings for temperature, humidity, PM2.5, carbon dioxide and TVOC. The described equipment is an HMI1004-HDMI gateway configured with X2View and connected to a monitor or signage display.
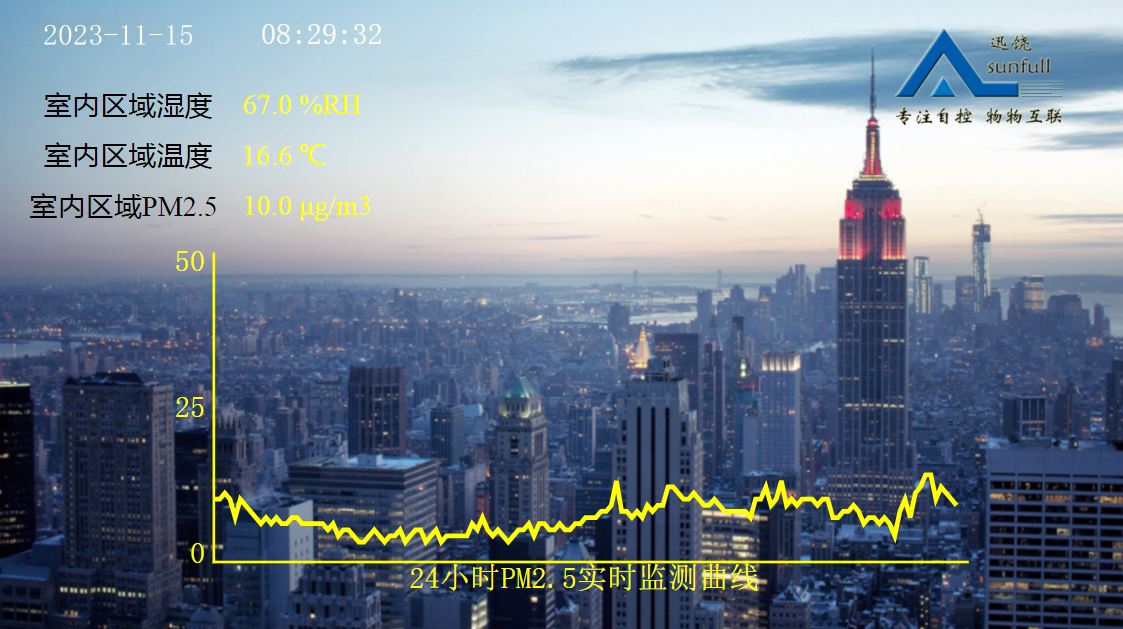
Original signage display example
Device-to-screen connection
The gateway acquires the example sensors over Modbus RTU. X2View is used to edit the HMI, bind the acquired points and upload the project. The gateway then provides the configured graphics through its HDMI output. Computers, phones or tablets on the configured network can also open the HMI using the gateway IP address.
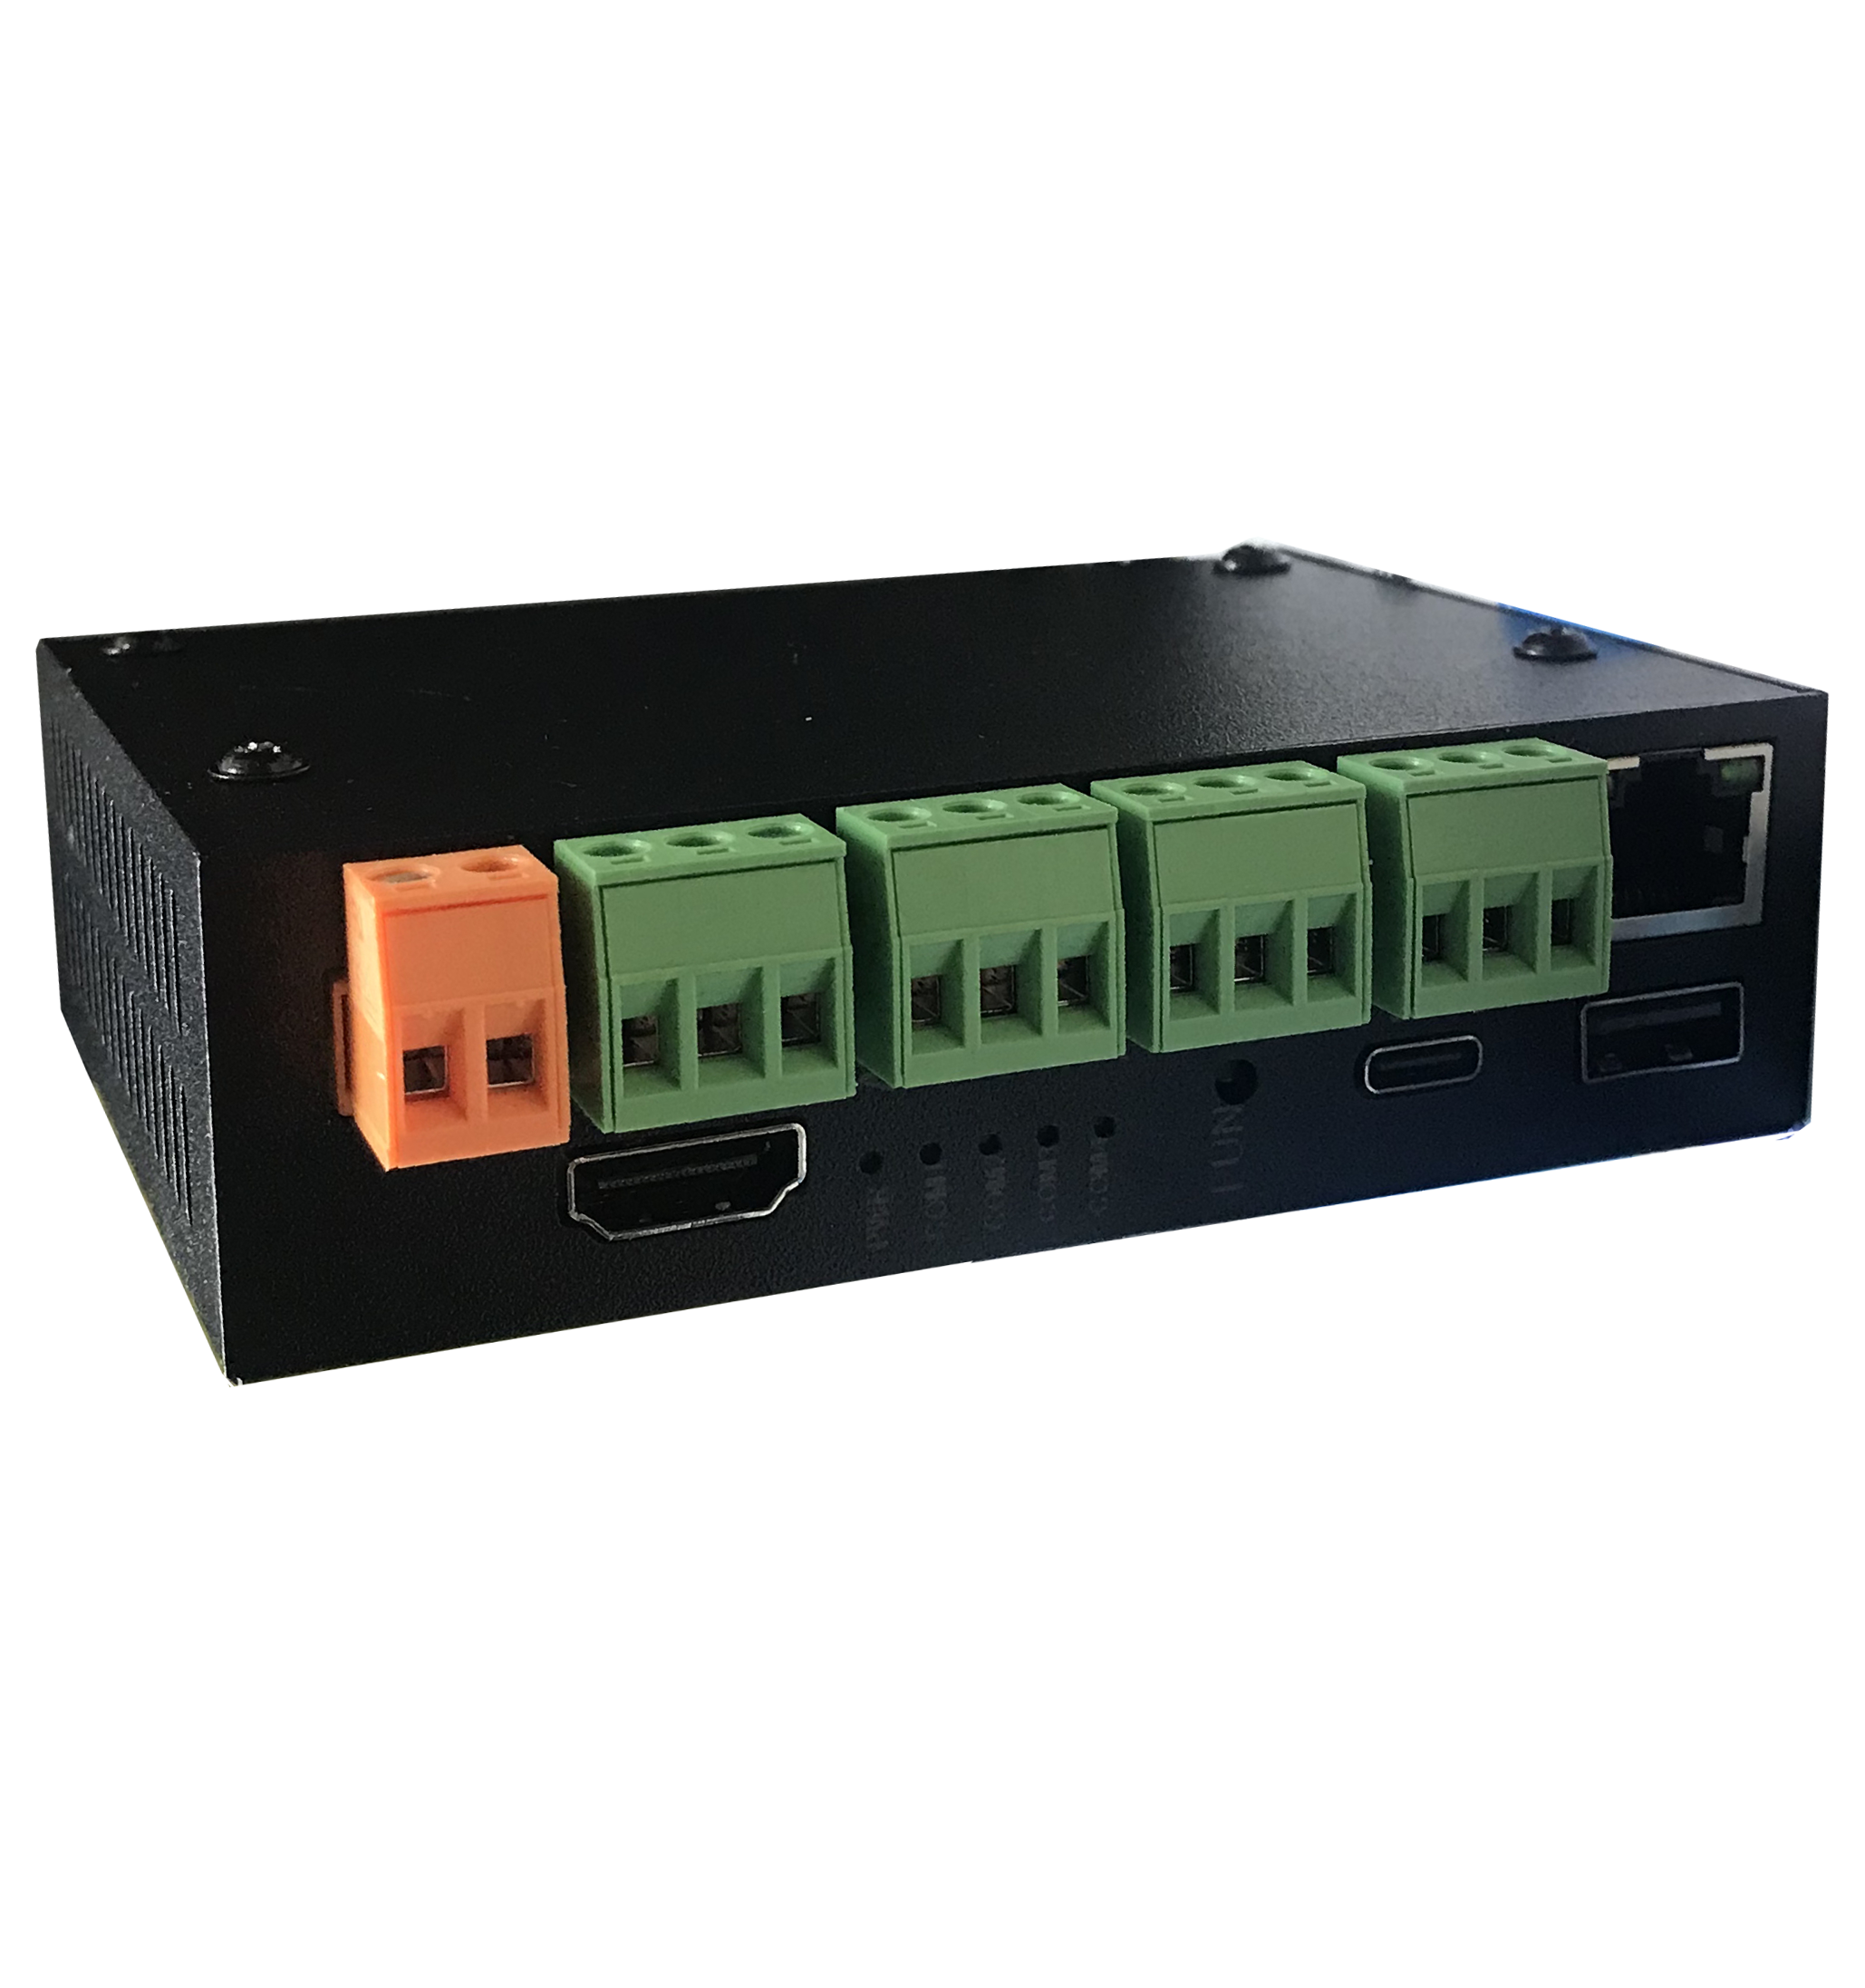
HMI1004-HDMI in the source
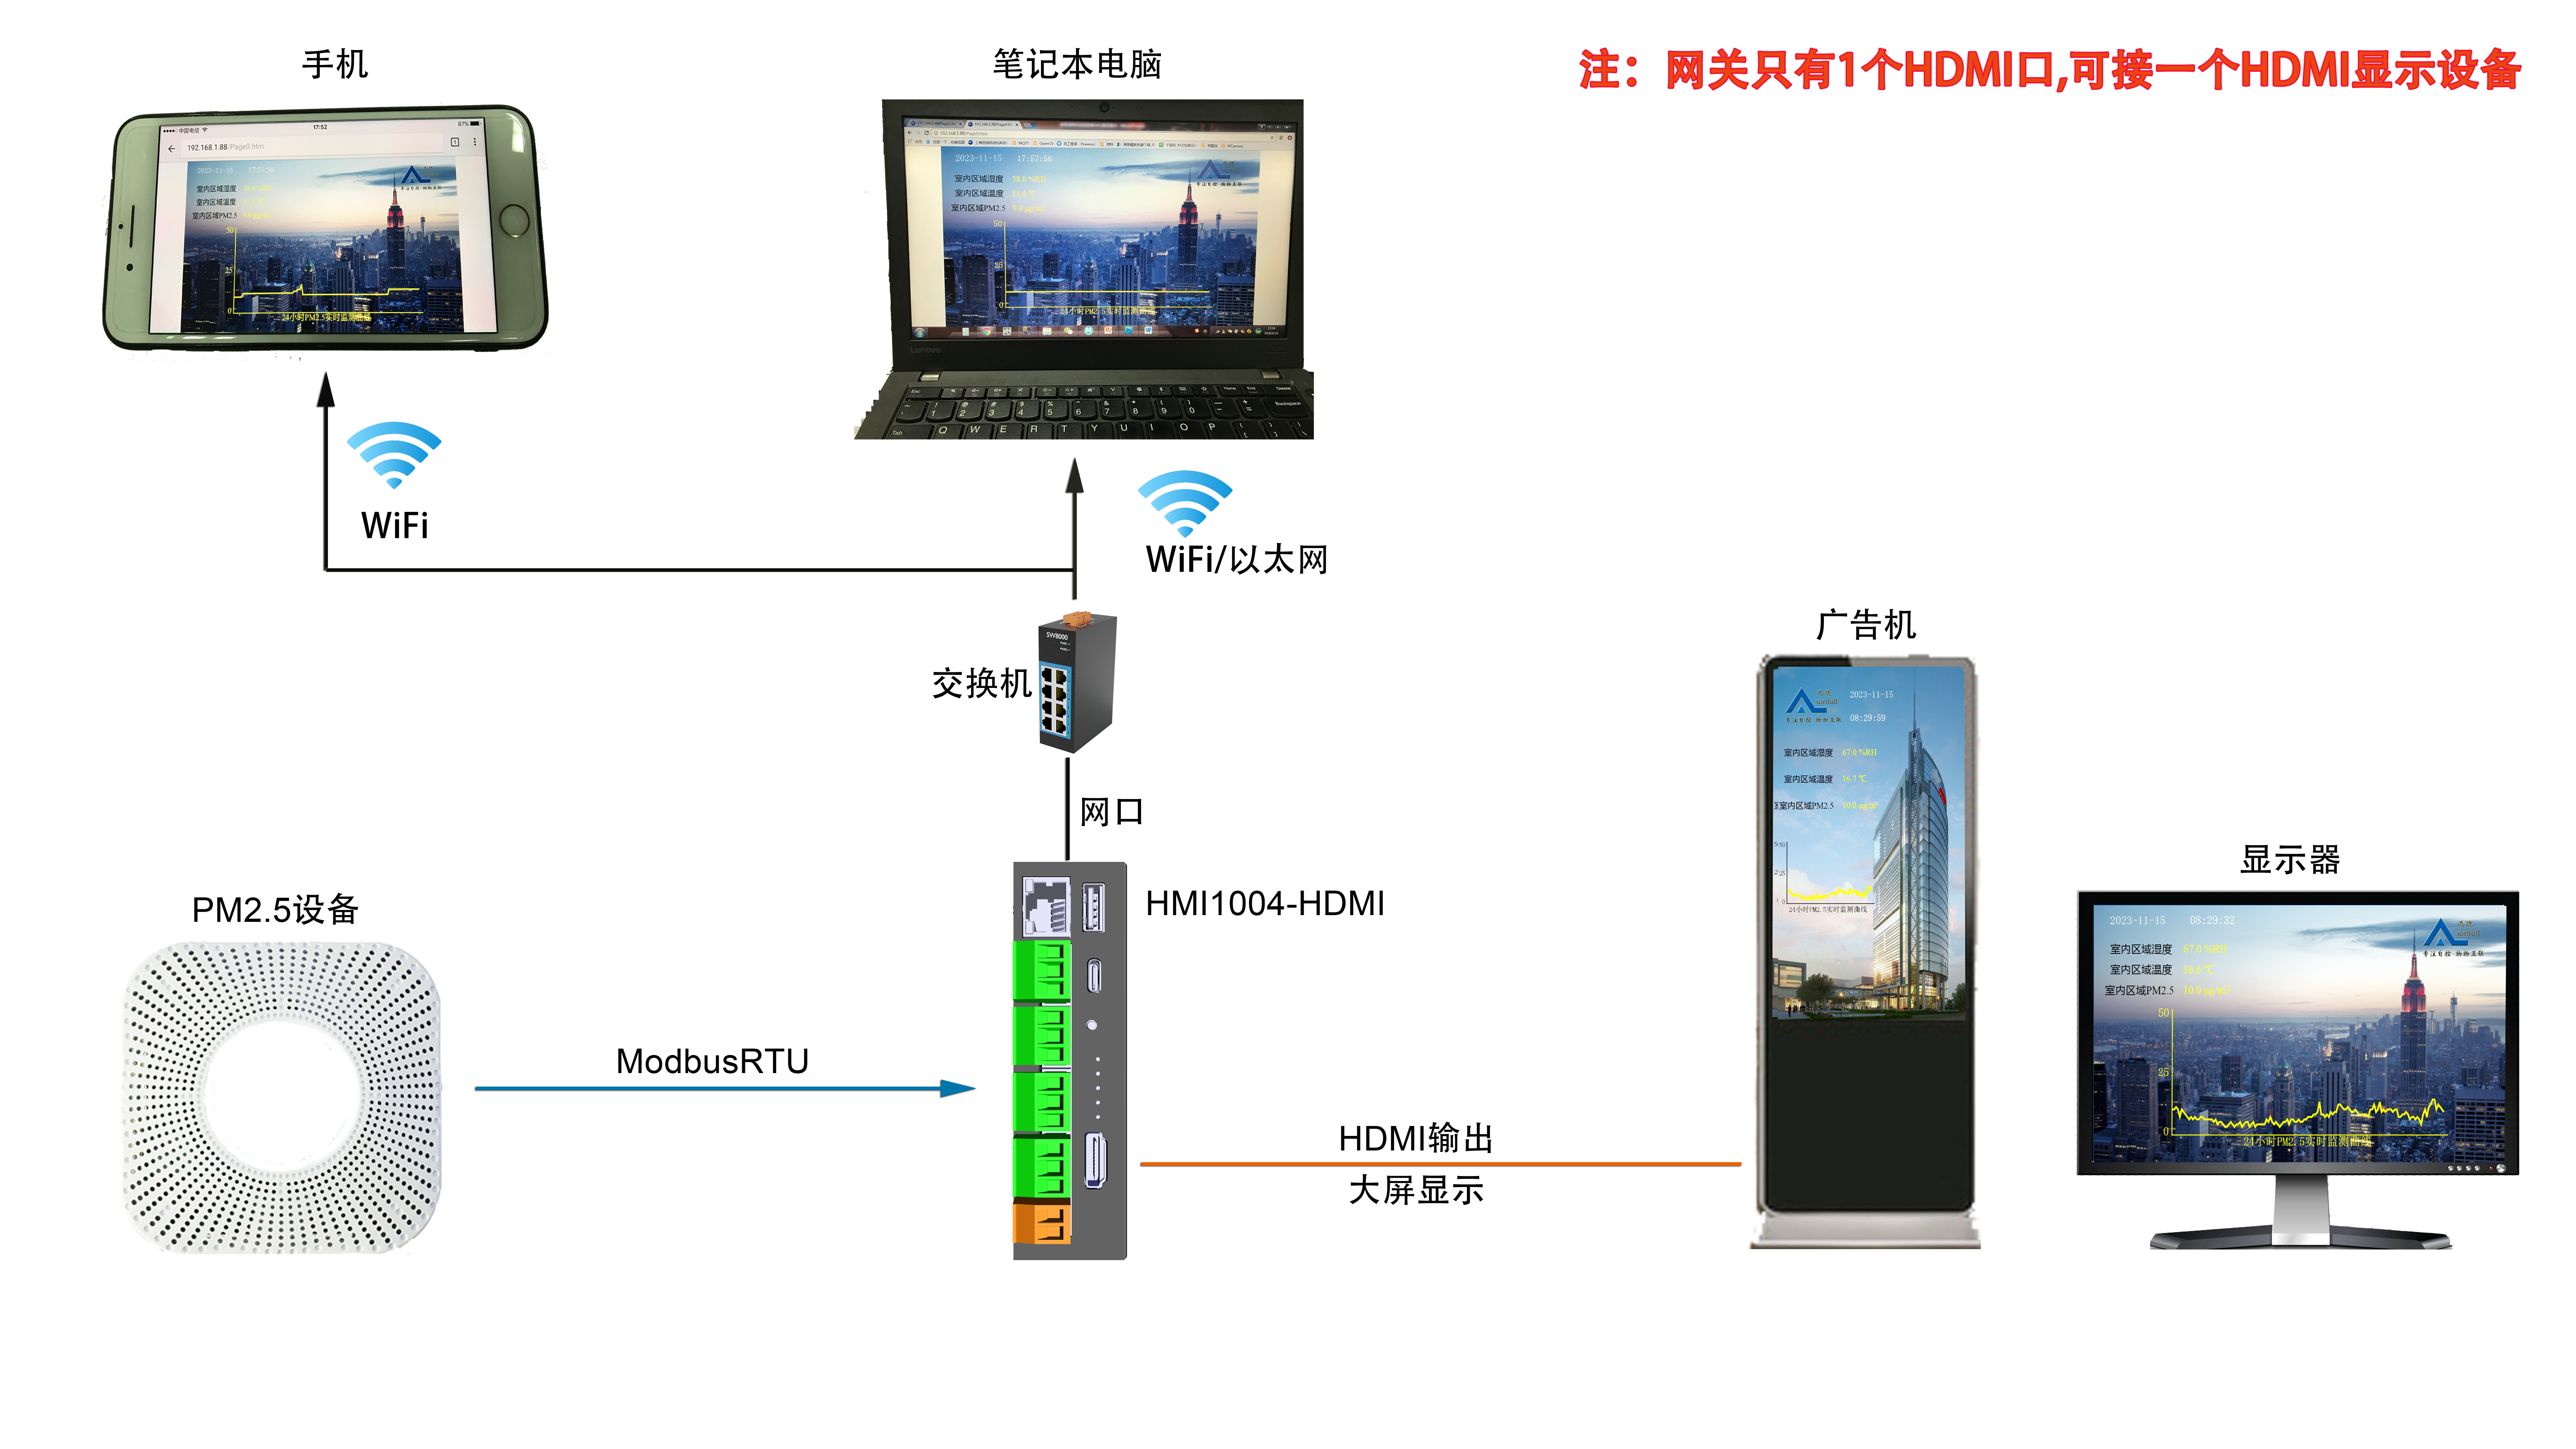
Original sensor, gateway and display connection diagram
The source also names BACnet/IP, BACnet MS/TP, Modbus TCP and Modbus RTU forwarding interfaces. Check the exact model and firmware documentation for the required role and enabled service; a list in a historical case does not confirm a particular current configuration.
Configuration sequence shown in the source
1. Confirm the sensor communication document
Use the actual sensor register map and scaling instructions as the basis for the acquired points.
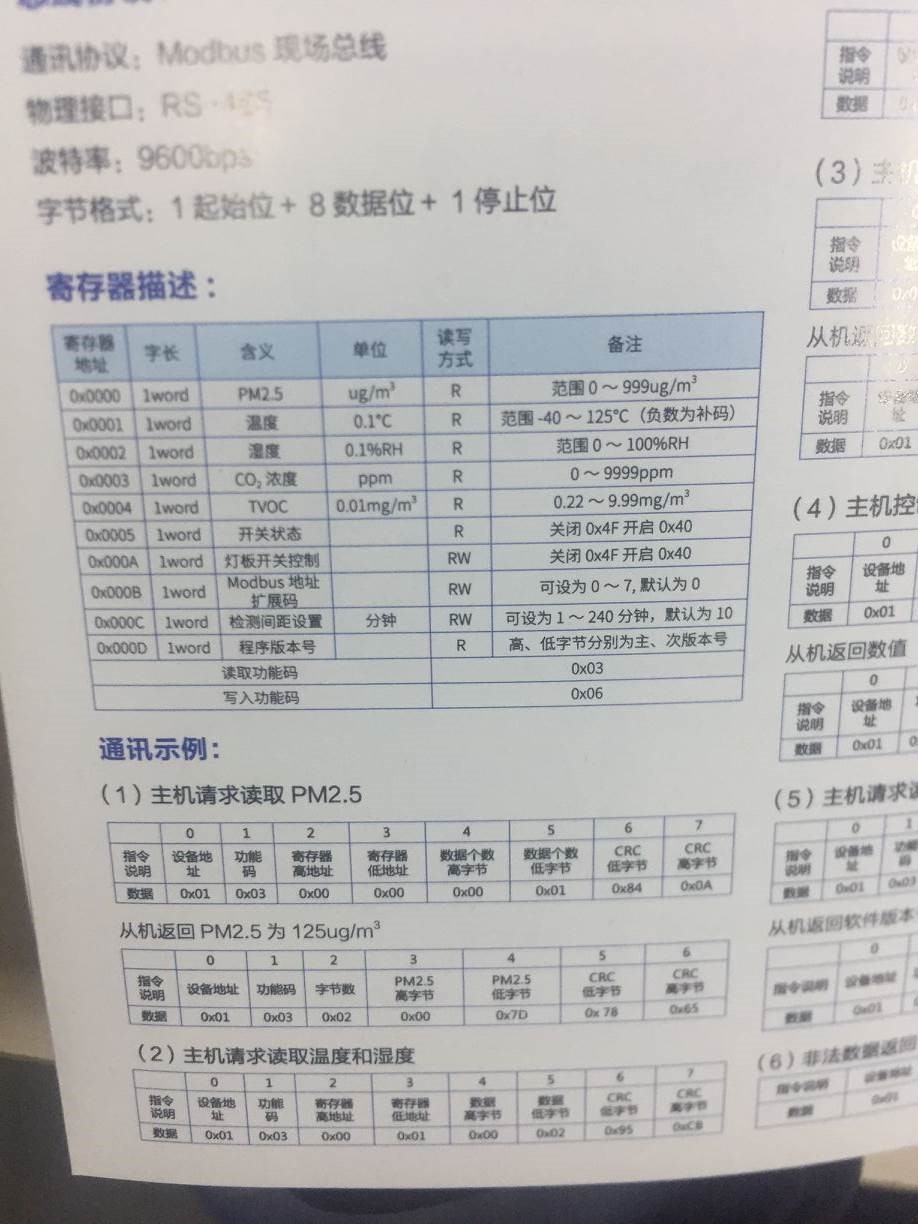
Original sensor communication document
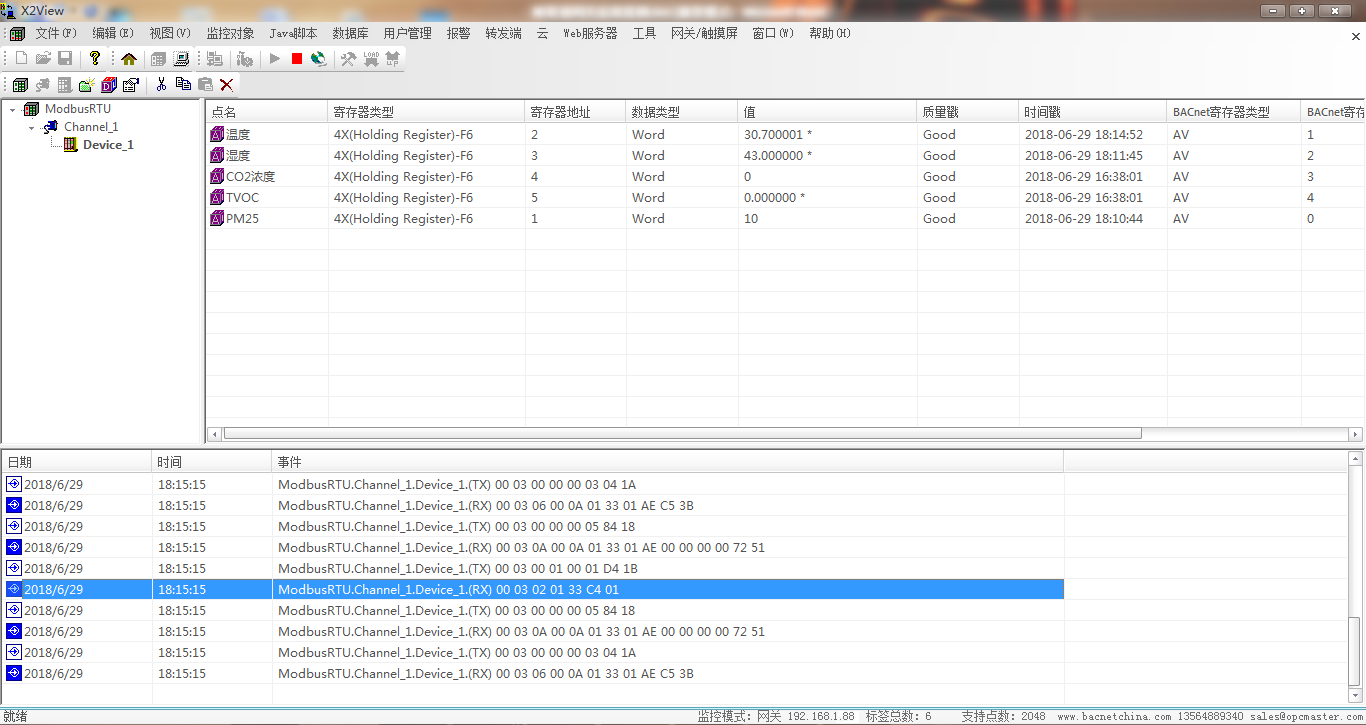
2. Configure the acquisition driver and points
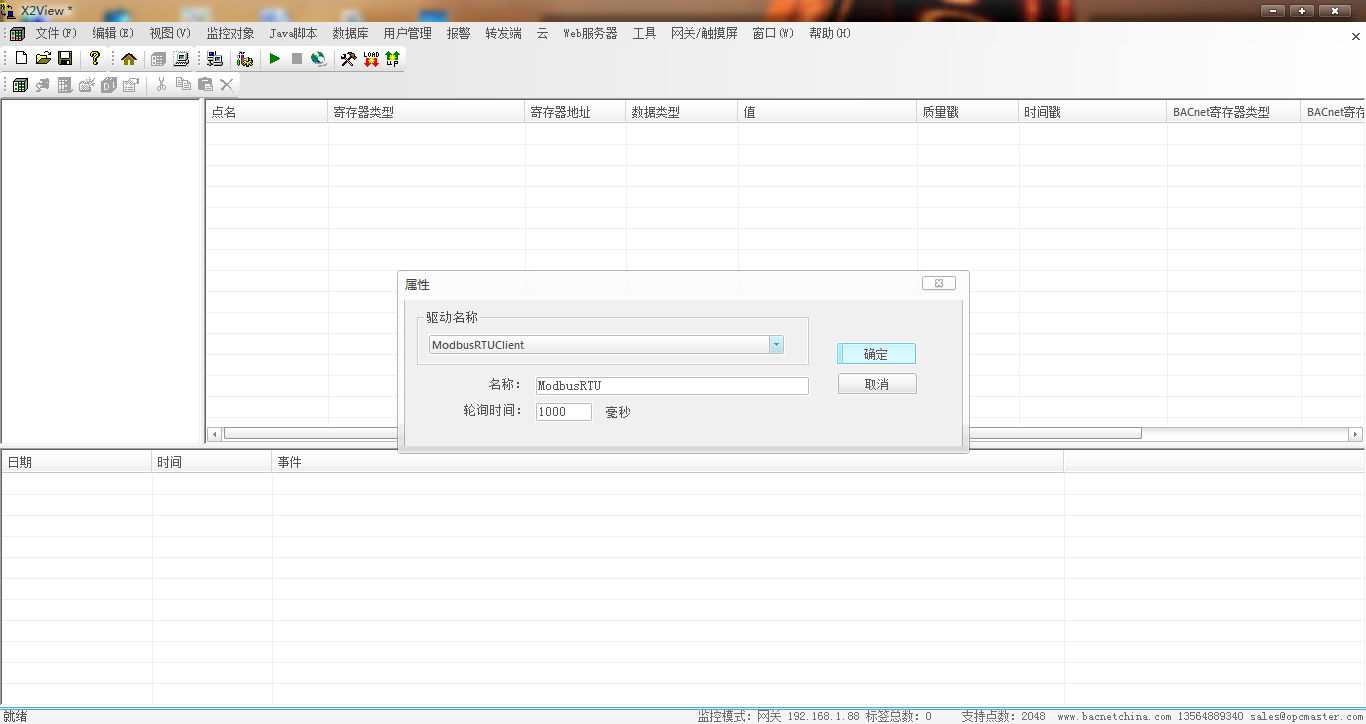
Original acquisition driver configuration
Original point configuration
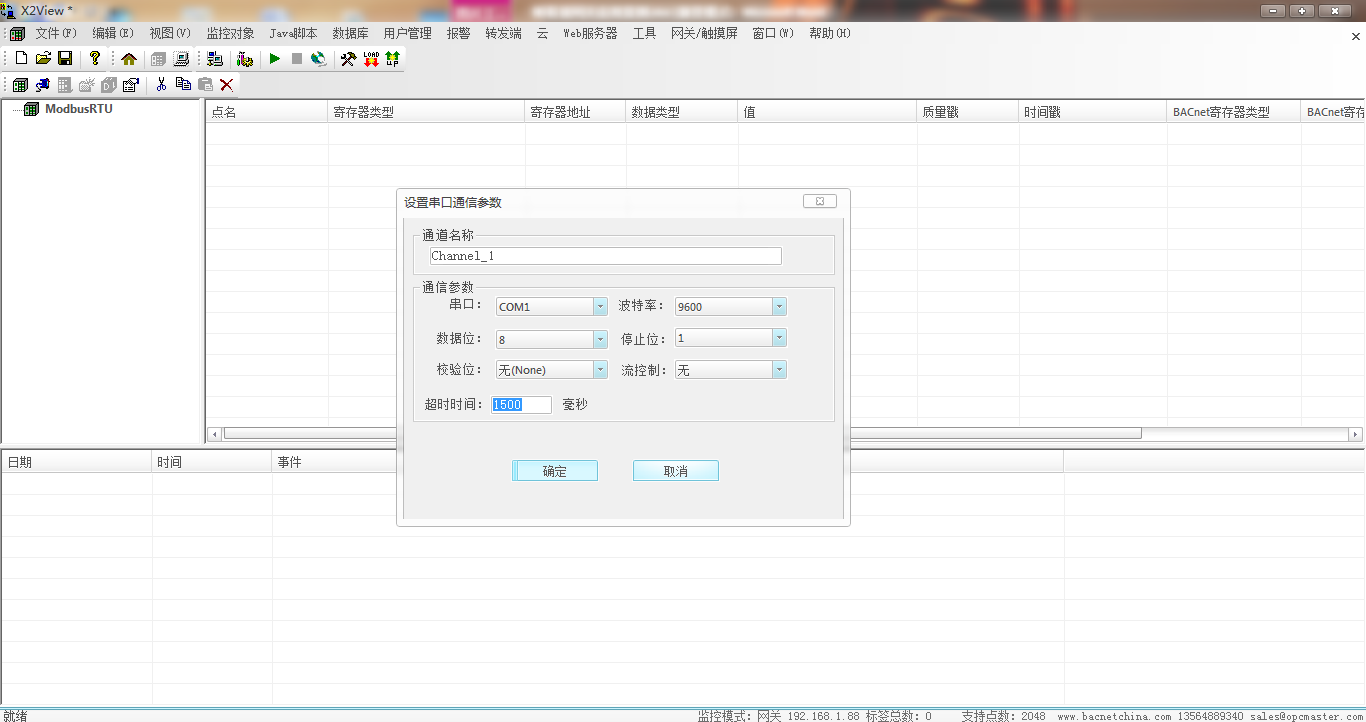
3. Check communication parameters
Original communication settings
4. Check the connected monitor
Original monitor display view 1

Original monitor display view 2
5. Check the signage layout

Original signage layout 1

Original signage layout 2
Project configuration notes
- Apply the linear conversion specified by the sensor communication document; do not infer the scale from the display alone.
- The display uses the gateway's internal time. Check and synchronize the clock if it is incorrect after the first upload.
- Choose an HDMI resolution suitable for the connected display and the model's supported settings.
- The original configuration places WiFi and Ethernet on different subnets. Verify the addressing arrangement for the actual hardware and firmware.
- The source's PM2.5 trend samples once per second. Changing its sampling interval requires a corresponding project change; it is not a fixed specification for every HMI.
The article provides setup and display screenshots, not a measured sensor-accuracy, refresh-rate or project-acceptance report. The original figures and their Chinese interface text are preserved below the translated explanations.